This article is a first one of planned series focused on log processing, therefore YSoft SafeQ monitoring. It explains goals of log monitoring and intended use cases, as well as requirements for designed architecture. A brief description of high-level view of designed architecture follows, architecture itself will be properly described in one of following articles.
Goals of YSoft SafeQ log processing
Logs contain information about behaviour of SafeQ deployment, but each log carries only limited local info (such as single Exception). This can directly lead to understanding, what has happened, but sometimes more logs, even from different components, are needed.
The main goal of log processing is to collect all logs to a central location, unify them to single format to simplify their structure, compute additional information, such as duration of a print process, and finally index this info into a database to allow searches and visualizations into graphs.
Such graphs are a much faster way to obtain info about YSoft SafeQ behaviour than to go through individual log files, for example, spikes in printing time can be easily identified and possibly correlated with additional WARN or ERROR logs. That allows us to understand YSoft SafeQ faster and better.
All that is usually used for fixing bugs, but can be used for many other things, as for help with improving performance or monitoring user-related activities. On the other hand, there are several requirements which need to be satisfied by log processing.
Requirements of log processing architecture
At first, log processing shouldn’t significantly increase performance requirements on YSoft SafeQ servers, therefore logs should be forwarded by a network on a different server. That requires some network bandwidth, but on the other hand, logs don’t have to be saved on hard disk. Also, some network bandwidth can be saved by compressing, in exchange for some CPU time.
Even with logs being sent over the network, the reliability should stay the same as with writing logs directly into files. That is provided by a number of mechanisms:
- when a connection is temporarily unavailable, generated logs should be buffered on a hard disk and automatically resent, when the connection is established
- reliable protocol (such as TCP) is used
- target server can properly work even under heavy load. Note, that multiple YSoft SafeQ servers can forward logs into one destination and there can be also big spikes when many logs are generated at once
Another requirement for log processing is low end-to-end latency. While it is no problem for reporting purposes to collect and aggregate data once a week, for debugging or bug fixing the logs should be processed in order of seconds/minutes.
Lastly, processing of logs should be scalable, so it can be easily enlarged for bigger YSoft SafeQ deployments.
(Note: these are not the only requirements, but the most important ones. More detailed info can be found in my bachelor thesis)
Architecture overview
The main idea is that generated logs are processed as a stream. As soon as a log is generated, it is forwarded from YSoft SafeQ server to a queue on a monitoring server. Queue serves as a buffer when there is a spike in a number of incoming logs or the rest of monitoring is being reconfigured. Kafka is used as persistent and fast performing queue.
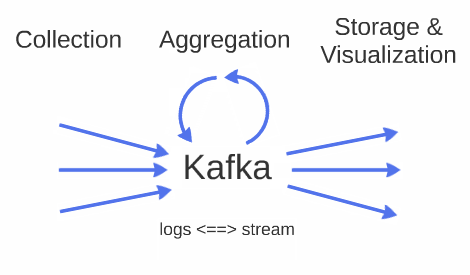
Various tools and software can be used „above“ queue to unify logs, aggregate various information, compute a duration of processes (duration of a print job), correlate logs and metrics. Still, logs are processed as a stream, therefore they can’t be replayed or queried as in conventional databases, which makes aggregation more complex. For example, computation of elapsed time between two logs needs to consider logs out of order or missing logs, this will be explained in detail in one of following articles. On the other hand, such approach makes overall latency much lower and it is more efficient (despite more complex algorithms), since logs are processed just once.
At last, logs, metrics and computed data are stored and possibly visualized. Some data can be stored only into files (as logs), but metrics computed from them (as a duration of processes) can be indexed into a database to allow its visualization.
Moreover, this architecture can be simply extended, by another source of data, another tool for log processing or different storage method, online and without affecting the rest of processing pipelines.
The next article will cover data visualizations, with real examples from our testing environments.